
Sonoma Technology Study Examines Using Low-Cost Sensor Network to Measure the Spatial and Temporal Variability of Air Pollution
Clients
Sacramento Metropolitan Air Quality Management District (SMAQMD)
Low-cost air quality sensors can be used to examine the spatial and temporal variability of air pollution, provided that users make sufficient effort to quality control the collected data. Sonoma Technology published a study in the journal <a href="https://www.mdpi.com/1424-8220/19/21/4701/htm" target="new"><i>Sensors</i></a href> that examined the precision of 19 low-cost AirBeam sensors that were used as part of an <a href="/projects/4011" target="new">Sonoma Technology project</a href> that monitored and determined the spatial variability of particulate matter (PM) in Sacramento, California. <br>
Prior to and after the study, the 19 sensors were deployed and collocated at a regulatory air monitoring site, and demonstrated a high degree of precision. A sensor-specific correction factor was developed to ensure each sensor reported a comparable value. The AirBeam sensors also had a moderate degree of correlation with regulatory monitors. The collected measurements were used to estimate the spatial variability of particulate matter between environmental justice (EJ) and non-EJ communities, and the results showed no significant difference in average concentrations between the communities.<br>
The abstract of the article is below:<br>
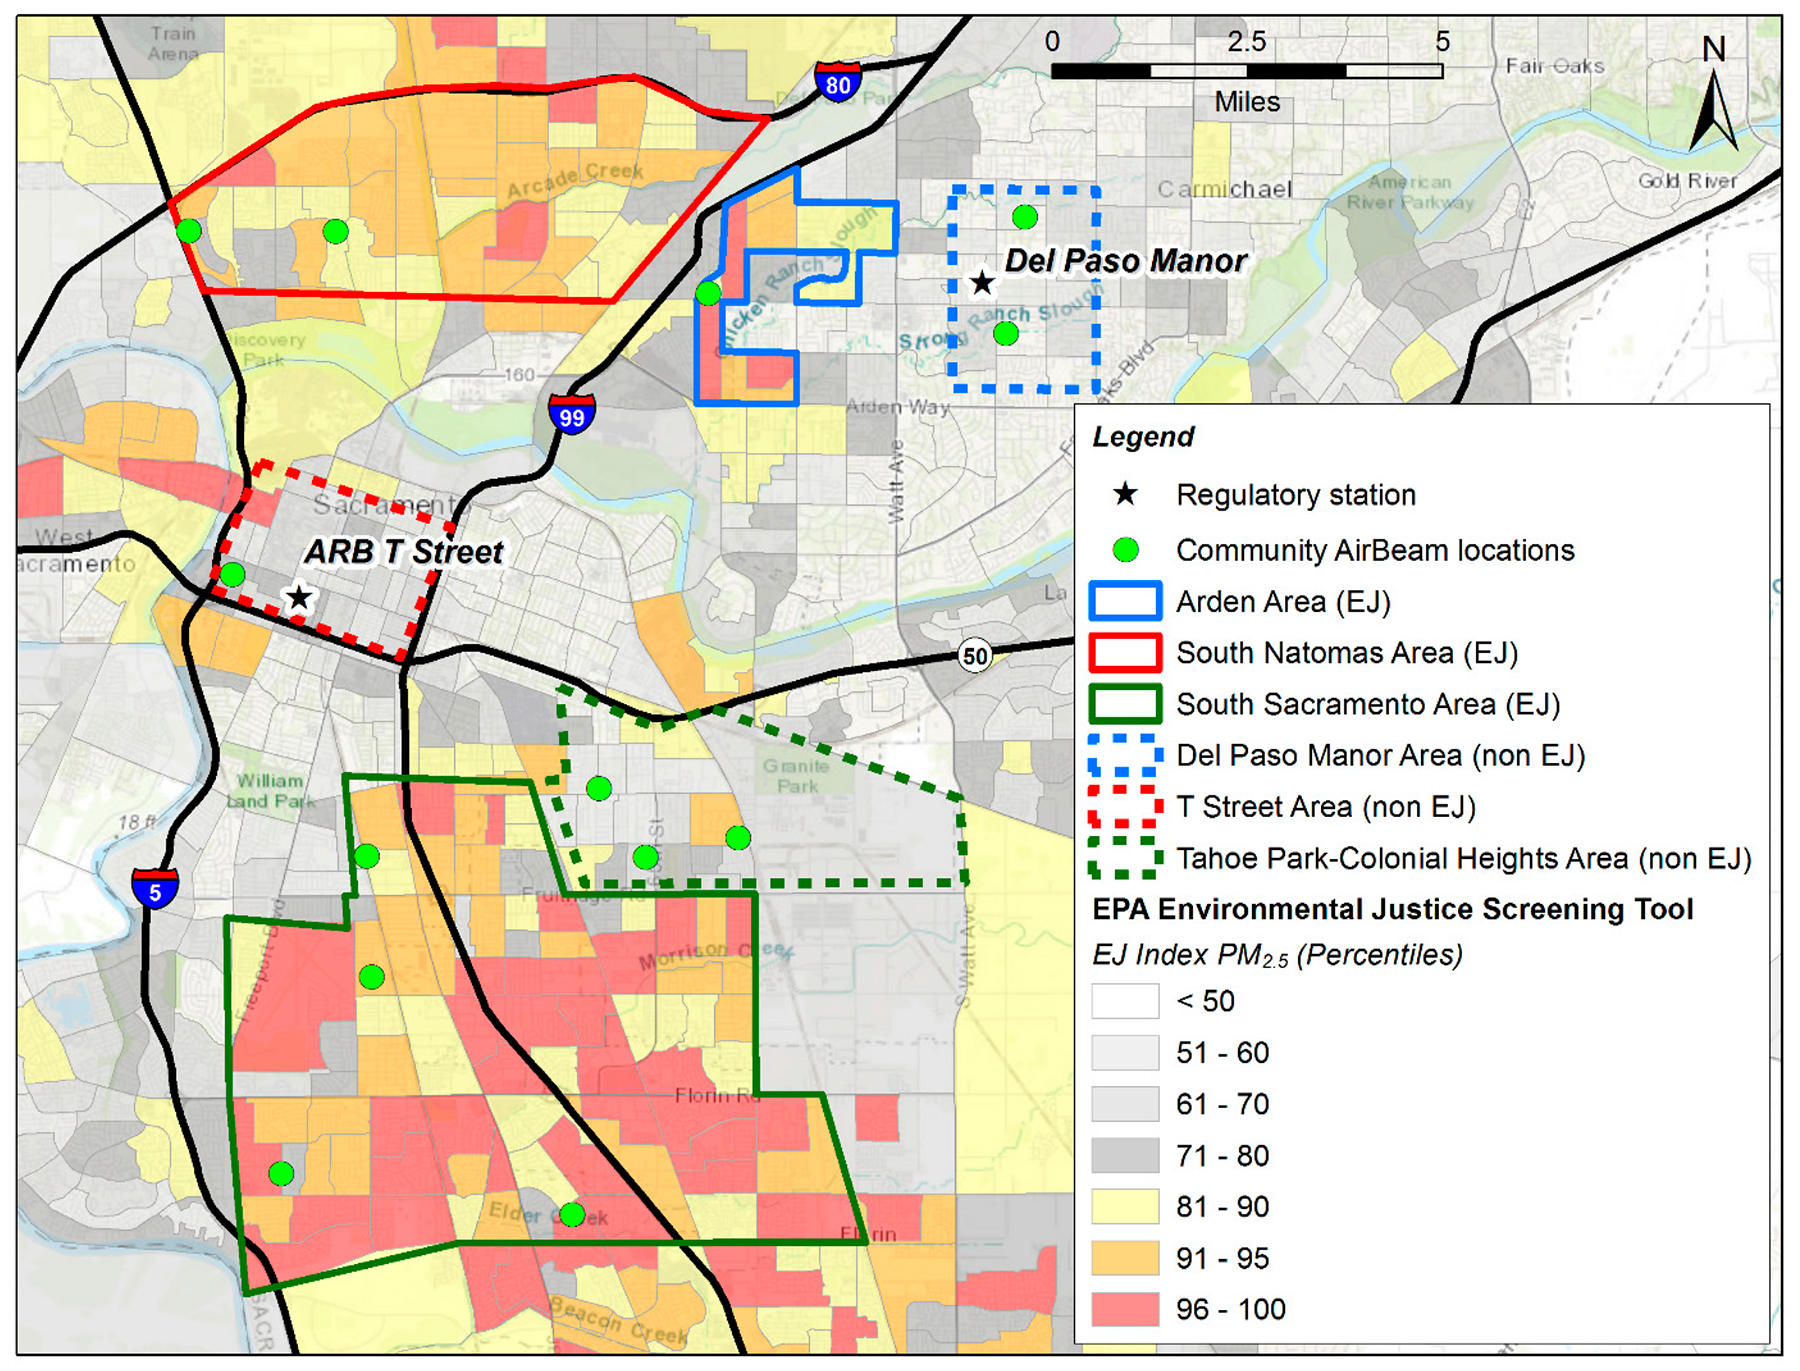
Low-cost sensors can provide insight on the spatio-temporal variability of air pollution, provided that sufficient efforts are made to ensure data quality. Here, 19 AirBeam particulate matter (PM) sensors were deployed from December 2016 to January 2017 to determine the spatial variability of PM<sub>2.5</sub> in Sacramento, California. Prior to, and after, the study, the 19 sensors were deployed and collocated at a regulatory air monitoring site. The sensors demonstrated a high degree of precision during all collocated measurement periods (Pearson R<sup>2</sup> = 0.98 − 0.99 across all sensors), with little drift. A sensor-specific correction factor was developed such that each sensor reported a comparable value. Sensors had a moderate degree of correlation with regulatory monitors during the study (R<sup>2</sup> = 0.60 − 0.68 at two sites). In a multi-linear regression model, the deviation between sensor and reference measurements of PM<sub>2.5</sub> had the highest correlation with dew point and relative humidity. Sensor measurements were used to estimate the PM<sub>2.5</sub> spatial variability, finding an average pairwise coefficient of divergence of 0.22 and a range of 0.14 to 0.33, indicating mostly homogeneous distributions. No significant difference in the average sensor PM concentrations between EJ and non-EJ communities (p value = 0.24) was observed.
Prior to and after the study, the 19 sensors were deployed and collocated at a regulatory air monitoring site, and demonstrated a high degree of precision. A sensor-specific correction factor was developed to ensure each sensor reported a comparable value. The AirBeam sensors also had a moderate degree of correlation with regulatory monitors. The collected measurements were used to estimate the spatial variability of particulate matter between environmental justice (EJ) and non-EJ communities, and the results showed no significant difference in average concentrations between the communities.<br>
The abstract of the article is below:<br>
Low-cost sensors can provide insight on the spatio-temporal variability of air pollution, provided that sufficient efforts are made to ensure data quality. Here, 19 AirBeam particulate matter (PM) sensors were deployed from December 2016 to January 2017 to determine the spatial variability of PM<sub>2.5</sub> in Sacramento, California. Prior to, and after, the study, the 19 sensors were deployed and collocated at a regulatory air monitoring site. The sensors demonstrated a high degree of precision during all collocated measurement periods (Pearson R<sup>2</sup> = 0.98 − 0.99 across all sensors), with little drift. A sensor-specific correction factor was developed such that each sensor reported a comparable value. Sensors had a moderate degree of correlation with regulatory monitors during the study (R<sup>2</sup> = 0.60 − 0.68 at two sites). In a multi-linear regression model, the deviation between sensor and reference measurements of PM<sub>2.5</sub> had the highest correlation with dew point and relative humidity. Sensor measurements were used to estimate the PM<sub>2.5</sub> spatial variability, finding an average pairwise coefficient of divergence of 0.22 and a range of 0.14 to 0.33, indicating mostly homogeneous distributions. No significant difference in the average sensor PM concentrations between EJ and non-EJ communities (p value = 0.24) was observed.
Related Links:
Air Quality
Applied Research
Emissions
Environmental Justice
Exposure
Health
Instruments
Low-Cost Sensors
Measurements
Modeling

Steve G. Brown

Steve
G.
Brown
Northern California Regional Director / Senior Atmospheric Scientist
sbrown@sonomatech.com
/sites/default/files/2023-07/SGBres.pdf